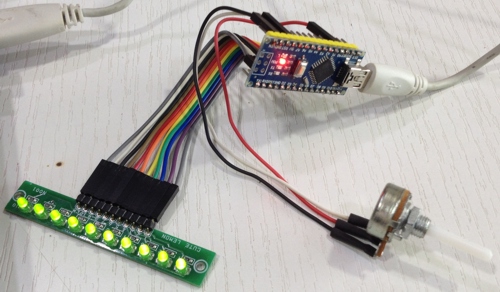
10 LED Bar-Graph Display- 10 Segment Bar-Graph Voltmeter Arduino Nano

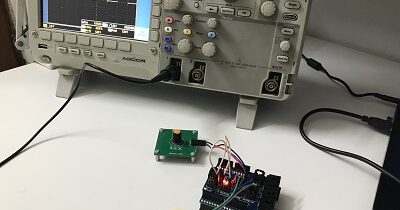
Turns on a series of 10 Segments of LEDs based on the value of an analog sensor. This is a simple way to make a bar graph display. This method can be used to control any series of digital outputs that depends on an analog input. Trimmer Potentiometer and Analog joystick used to test the code.
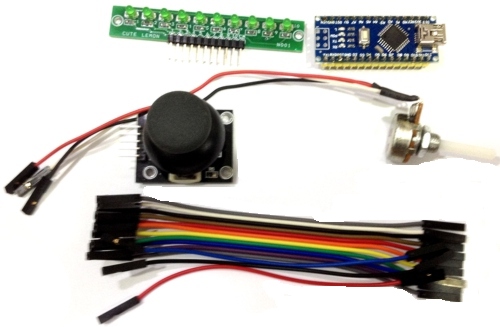
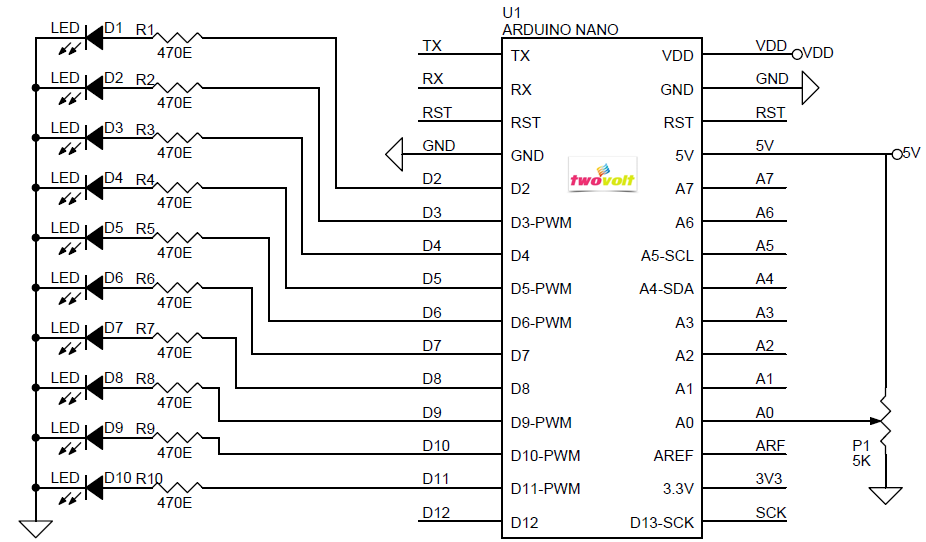
- 10 3MM LEDs
- 470 E Series Resistor to limit the current to LED
- 5K Ohms Trimmer Potentiometer/10K Joystick used to test the code
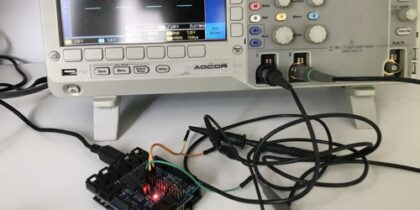
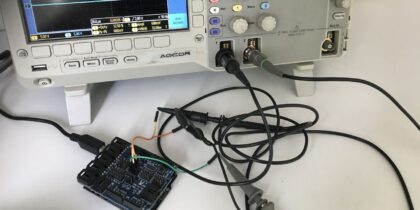
Video Available Here

Arduino Code 10 LED Bar-Graph Display / Bar-Graph 5 Voltmeter
/*
LED bar graph
Turns on a series of LEDs based on the value of an analog sensor.
This is a simple way to make a bar graph display. Though this graph uses 10
LEDs, you can use any number by changing the LED count and the pins in the
array.
This method can be used to control any series of digital outputs that depends
on an analog input.
The circuit:
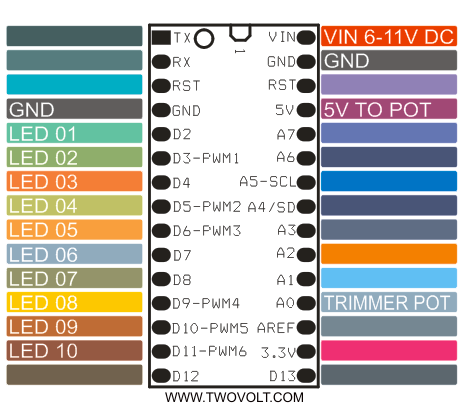
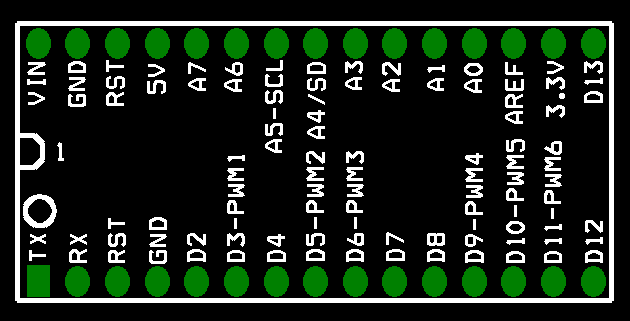
– LEDs from pins D2 through D11 to ground
-Trimmer Potentiometer 5K on A0
*/
// these constants won’t change:
const int analogPin = A0; // the pin that the potentiometer is attached to
const int ledCount = 10; // the number of LEDs in the bar graph
int ledPins[] = {
2, 3, 4, 5, 6, 7, 8, 9, 10, 11
}; // an array of pin numbers to which LEDs are attached
void setup() {
// loop over the pin array and set them all to output:
for (int thisLed = 0; thisLed < ledCount; thisLed++) {
pinMode(ledPins[thisLed], OUTPUT);
}
}
void loop() {
// read the potentiometer:
int sensorReading = analogRead(analogPin);
// map the result to a range from 0 to the number of LEDs:
int ledLevel = map(sensorReading, 0, 1023, 0, ledCount);
// loop over the LED array:
for (int thisLed = 0; thisLed < ledCount; thisLed++) {
// if the array element’s index is less than ledLevel,
// turn the pin for this element on:
if (thisLed < ledLevel) {
digitalWrite(ledPins[thisLed], HIGH);
}
// turn off all pins higher than the ledLevel:
else {
digitalWrite(ledPins[thisLed], LOW);
}
}
}